Dashboard guide
How to read the SOFIA dashboard — the 5 views, what each shows, and what to look for. This guide covers the dashboard UI. For how to generate data and run the server, see analysis-guide.md. For conformity checks, see audit-guide.md. The dashboard is specific to the filesystem binding (
binding/filesystem/). It instruments real session logs and artifacts — nothing is simulated.
The 5 views
| View | Question | Content |
|---|---|---|
| Map | What does the organization look like? | Instance topology, persona cards, trajectory |
| Mirror | Am I healthy as an orchestrator? | KPIs, radars, trajectory, contribution flow |
| Lens | What happened over time? | Time series, per-persona breakdown, distributions |
| Probe | Is the instance structurally conforming? | Pass/warn/fail checks, signals |
| Legend | How do I read all this? | In-dashboard documentation of every metric |
Map
Entry point. Shows the functional topology of your SOFIA setup.
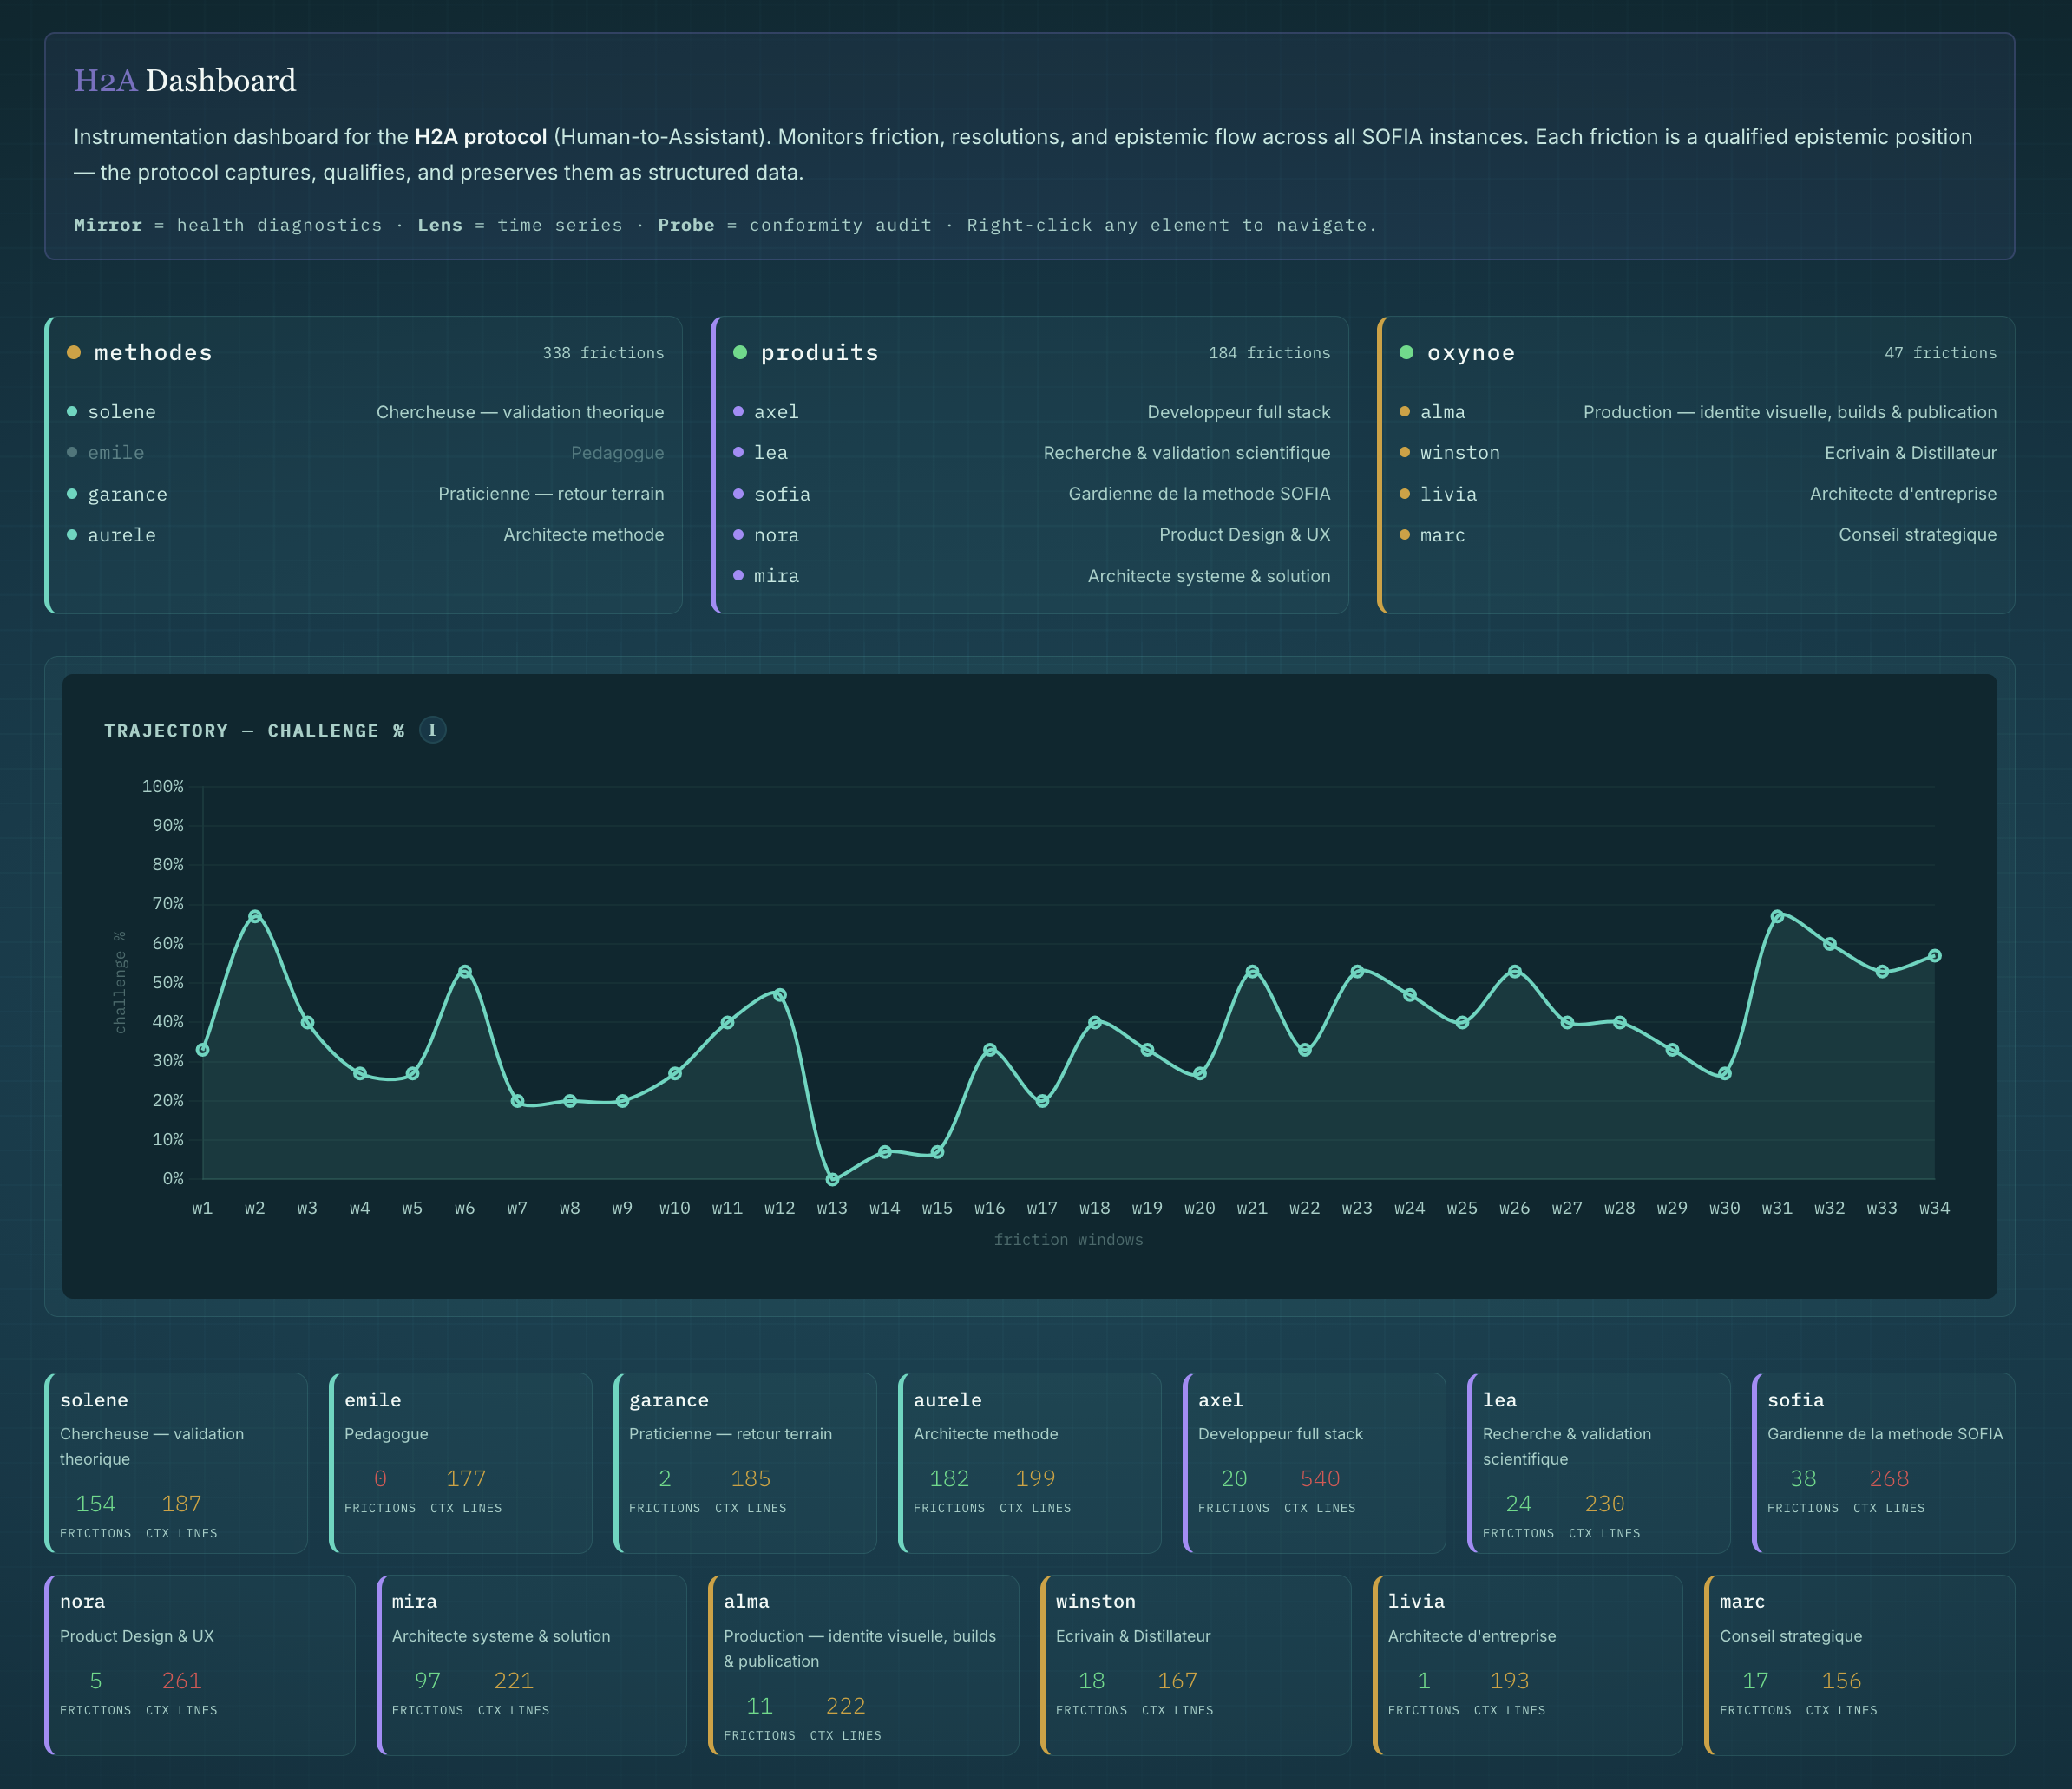
Instance cards
One card per instance (top row):
- Health dot (green/orange/red) — percentage of personas with friction data
- Persona list — each persona with their role. Greyed-out = no friction (blind spot)
- Friction count — total frictions detected (top right of each card)
Right-click any instance or persona to navigate directly to Mirror, Lens, or Probe with the filter pre-selected.
Trajectory
Challenge % over time using friction windows (not calendar). A descending line = the instance is going quiet. Hover for date range per window.
Persona mini cards
Bottom row: one small card per persona showing friction count and context size (lines loaded at boot). Color-coded: green = healthy, yellow = attention, red = danger.
Mirror
The orchestrator sees their own practice reflected back.
KPI banner

Five indicators at the top:
| KPI | What it measures | Healthy | Warning |
|---|---|---|---|
| Orchestrator | Is the orchestrator still pushing back AND resolving? | "healthy" (green) | "complacent" (red) — H→A = 0 AND >10 open frictions |
| Recent challenge | Challenge % of last N frictions (non-sound share) | Stable above 20-30% | Dropping toward 0% |
| Open frictions | Frictions without resolution — piloting debt | Low count, decreasing | Growing backlog |
| Coverage | % of personas with at least one friction | 100% (green) | ≤50% (red) — half the team is invisible. Shows count (e.g. 3/4) |
| PO / A contrib | Epistemic contributions — orchestrator vs assistants | Balanced | Heavy imbalance either way |
Instance radar
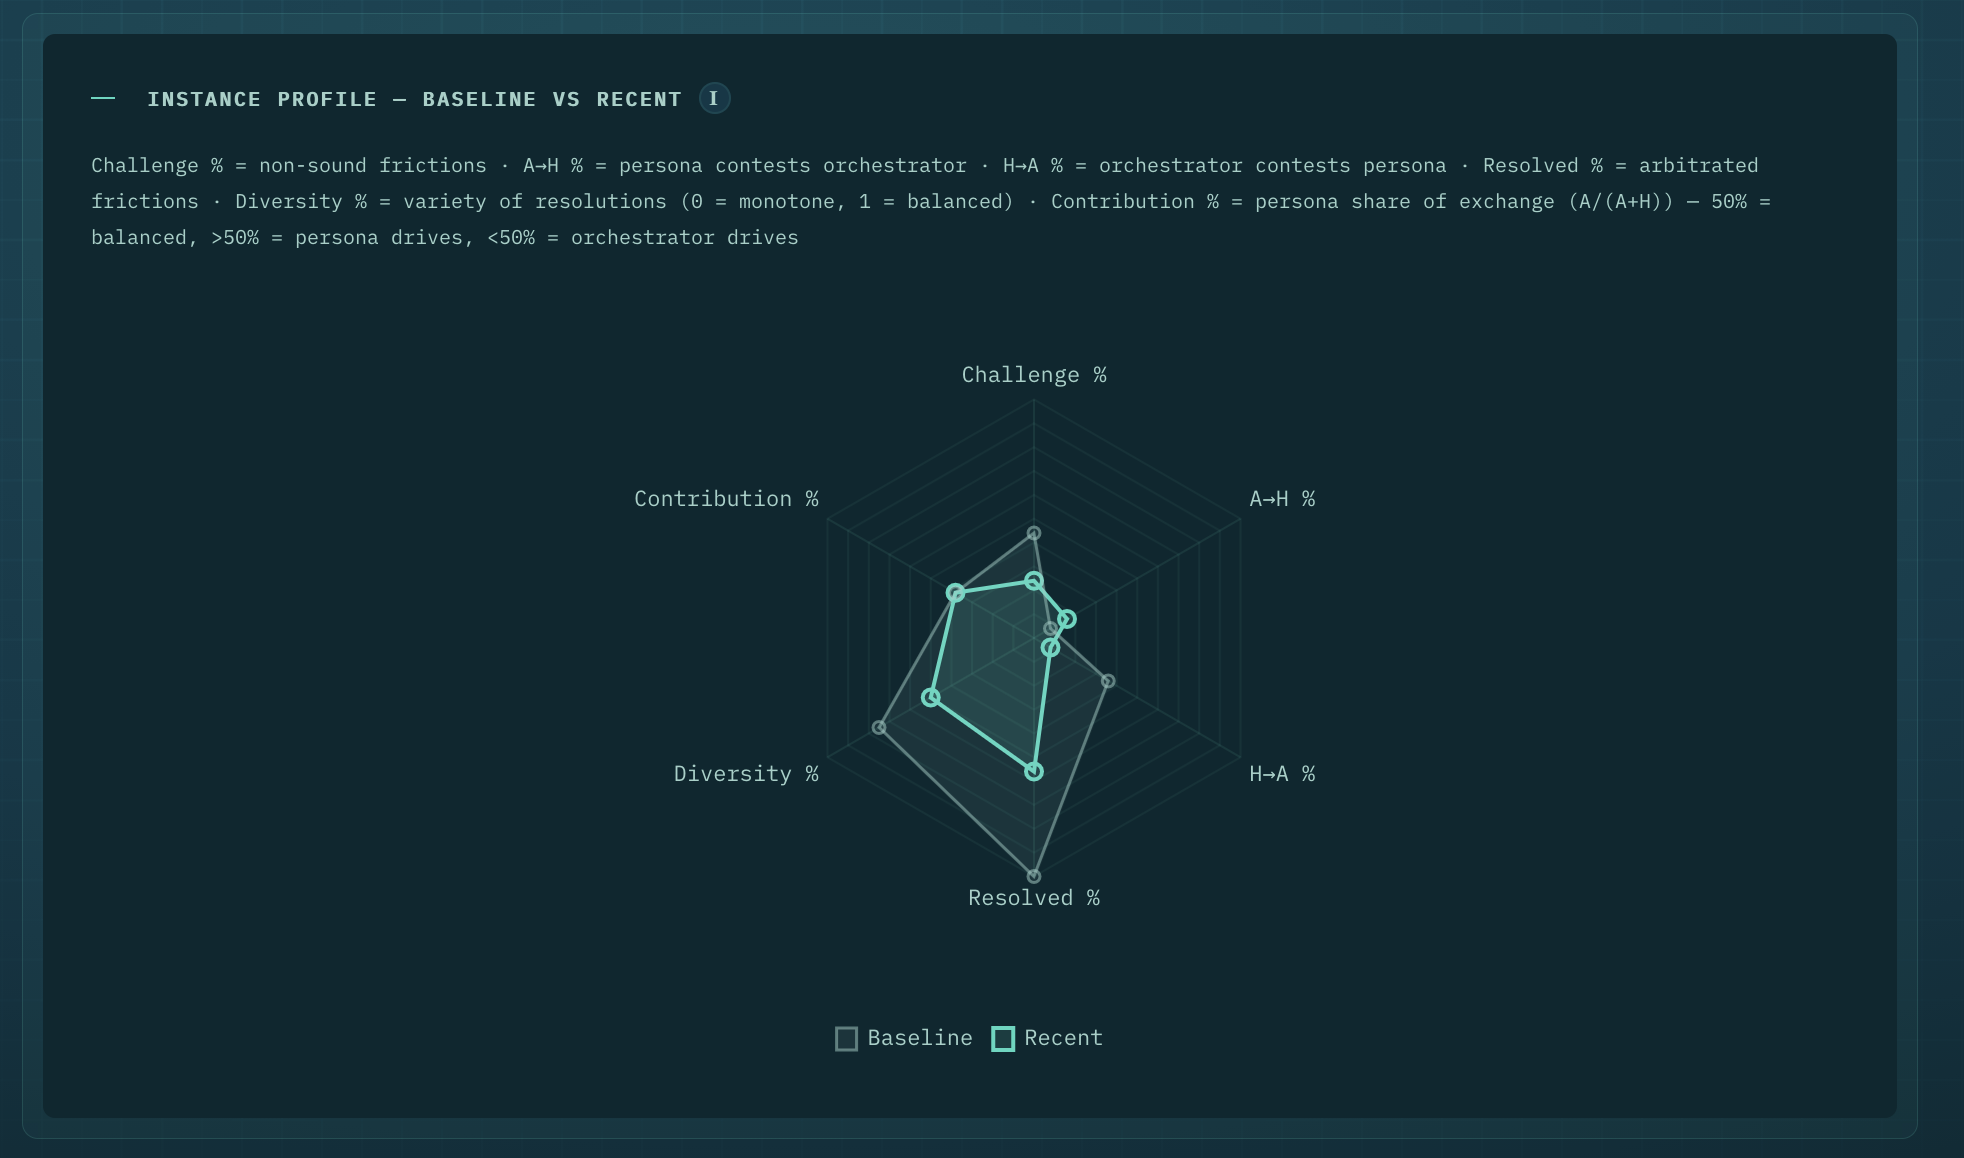
6 axes. Two contours: grey (baseline — first N frictions) and colored (recent — last N frictions). If the colored contour shrinks, the practice is degrading.
| Axis | Formula | Meaning |
|---|---|---|
| Challenge % | (contestable + simplification + blind_spot) / total | How much friction is actual pushback vs validation |
| A→H % | AI contests human / total | Persona pushes back on the orchestrator |
| H→A % | Human contests AI / total | Orchestrator pushes back on persona |
| Resolved % | resolved / total | Frictions with explicit decisions |
| Diversity % | distinct resolution types / 4 | Variety of decisions (25% = only ratified, 100% = all four) |
| Contribution % | A / (A + H) | Persona's share of the epistemic exchange |
Persona radars
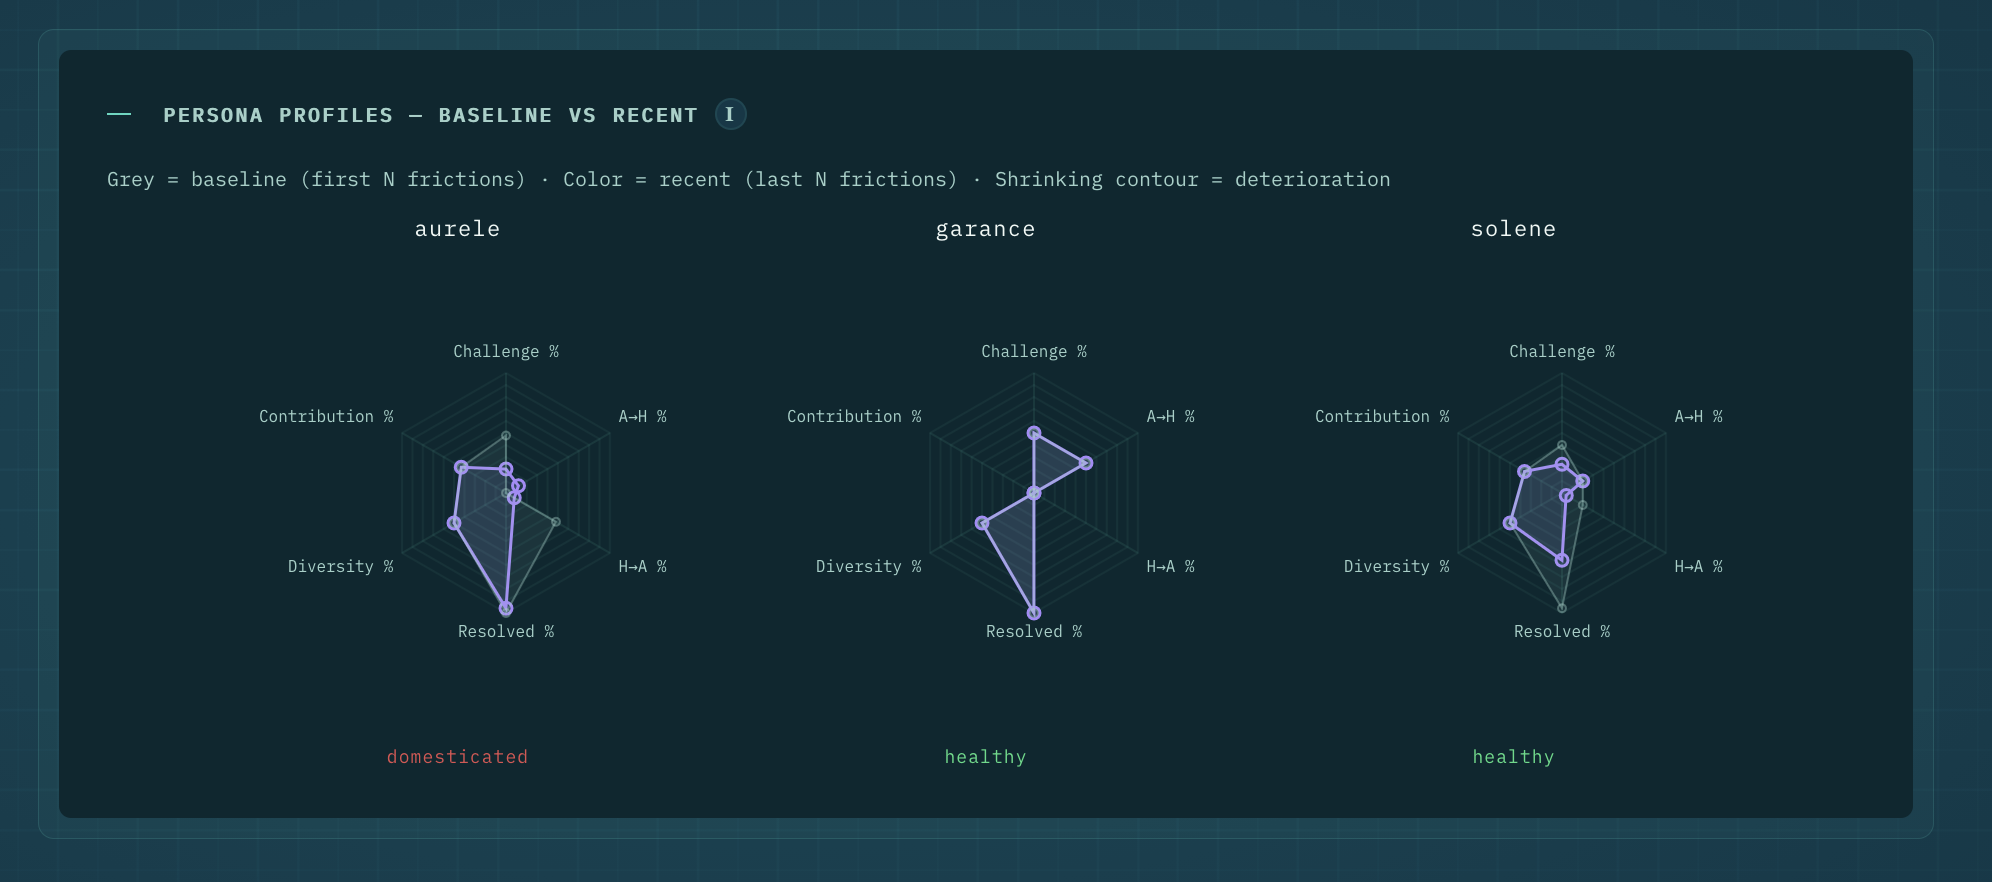
One radar per persona, displayed side by side. Same 6 axes as the instance radar. Each persona gets failure mode tags below — non-exclusive (a persona can cumulate several modes):
| Tag | Color | What it means |
|---|---|---|
| slip | amber | Friction exists but is not arbitrated — high non-resolution rate |
| wear | red | Surfaces polished — challenge % descending, marker entropy decreasing |
| crush | amber | One side imposes by force — high density + low revised rate |
| asymmetry | amber | Friction flows in one direction only — direction ratio beyond 20/80% |
| instability | amber | Change without convergence — revised dominant (>80%) |
A persona with no tags is "healthy" (green). Tags are computed from baseline vs recent comparison.
Trajectory
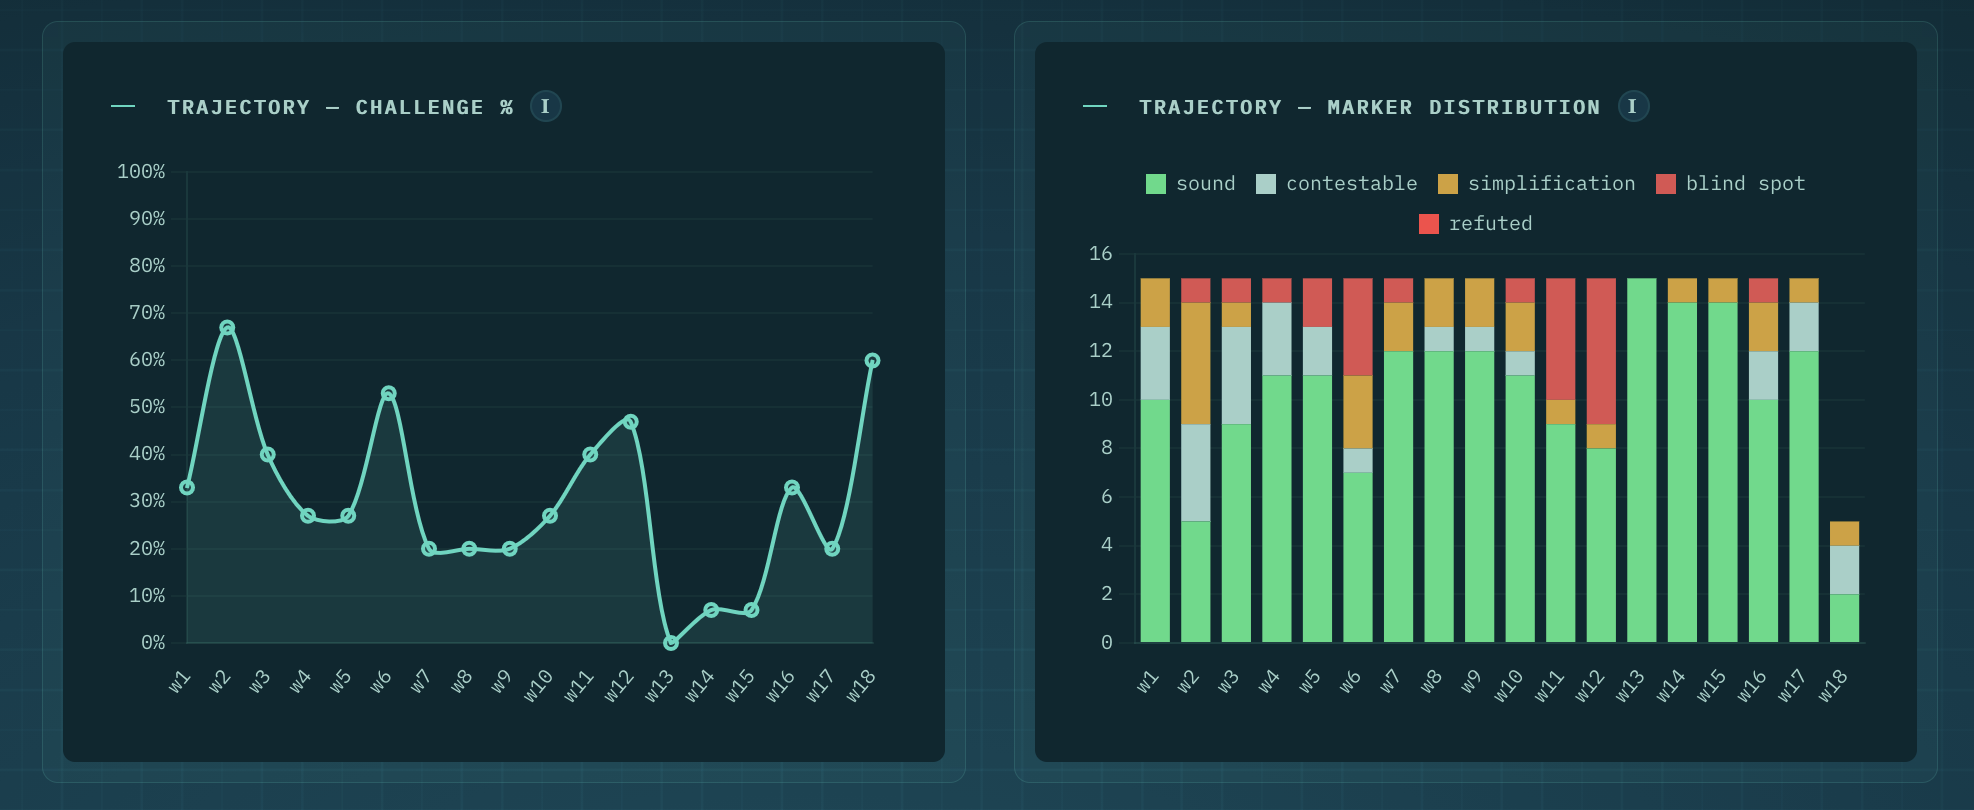
Two side-by-side views:
- Left — Challenge %: line chart by friction window (w1, w2...). A descending line = the instance is going quiet.
- Right — Marker distribution: stacked bar per window showing the breakdown (sound, contestable, simplification, blind_spot, refuted). Shows what kind of friction happens in each window.
Windows are not calendar-based — a window may cover 2 days or 2 weeks depending on friction density.
Contribution flow
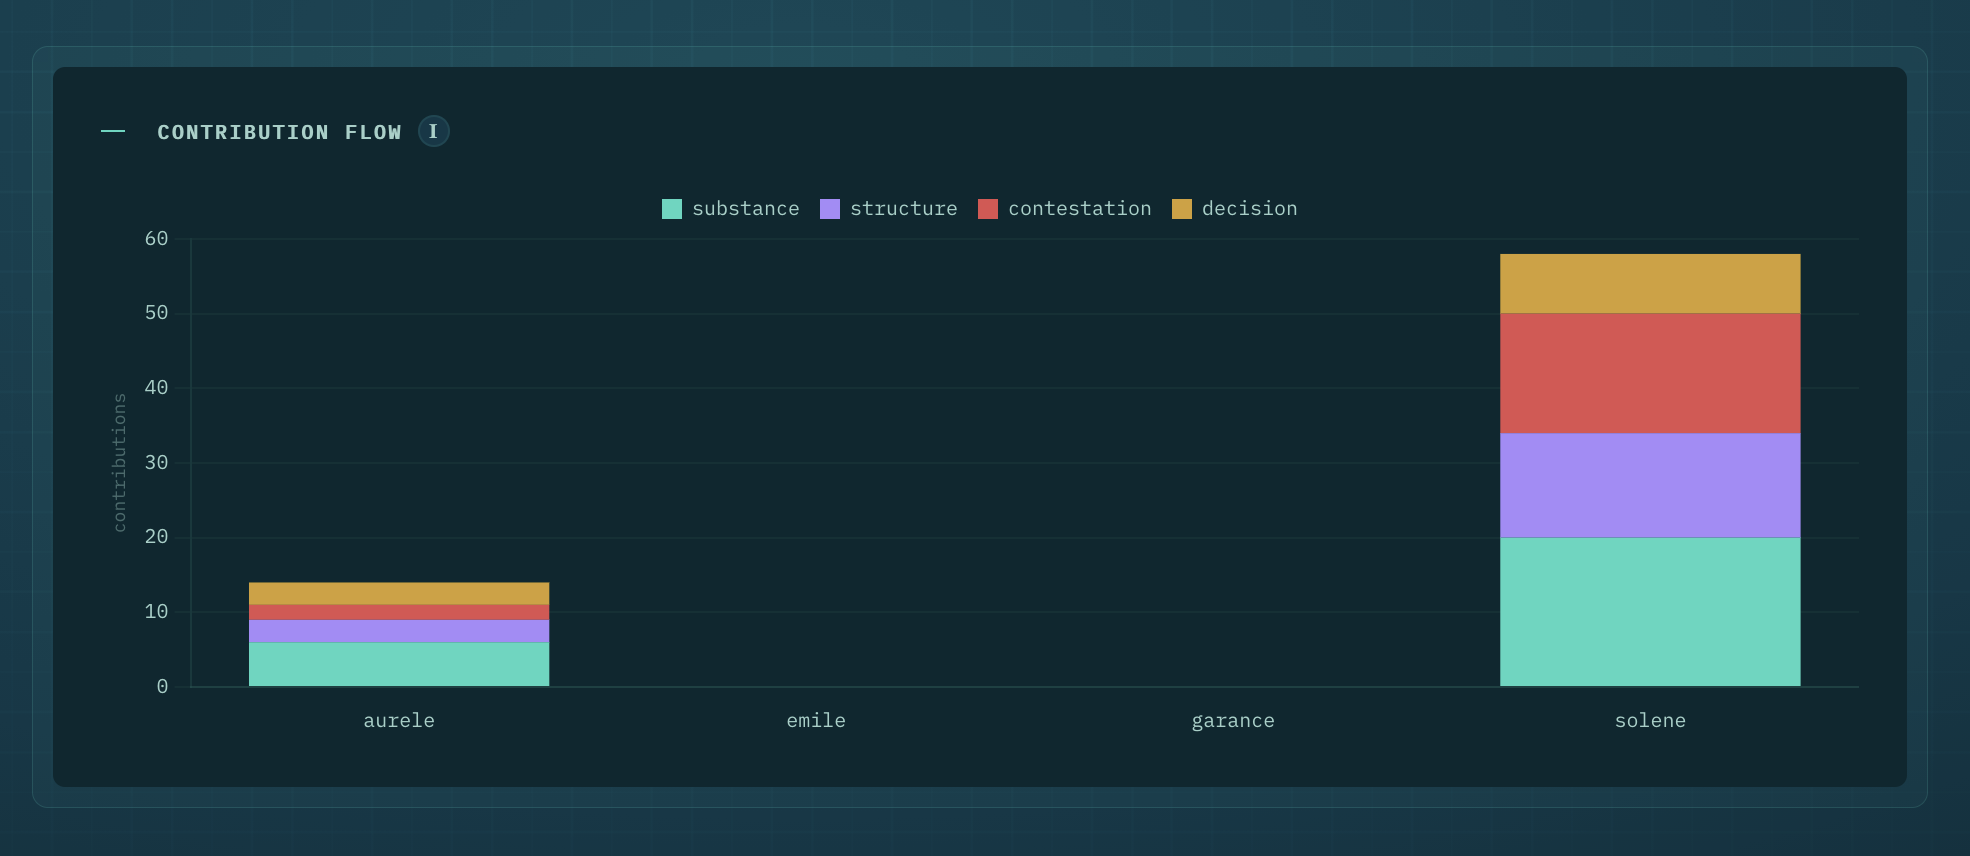
Stacked bar per persona showing the epistemic contribution breakdown:
| Type | Color | Meaning |
|---|---|---|
| substance | teal | New information — facts, data, references |
| structure | purple | Organization, categorization, synthesis |
| contestation | red | Challenge, counter-example, reframing |
| decision | gold | Arbitration, choice made |
A persona with mostly substance = content provider. A persona with mostly contestation = challenger. The orchestrator typically brings decision.
Delta table
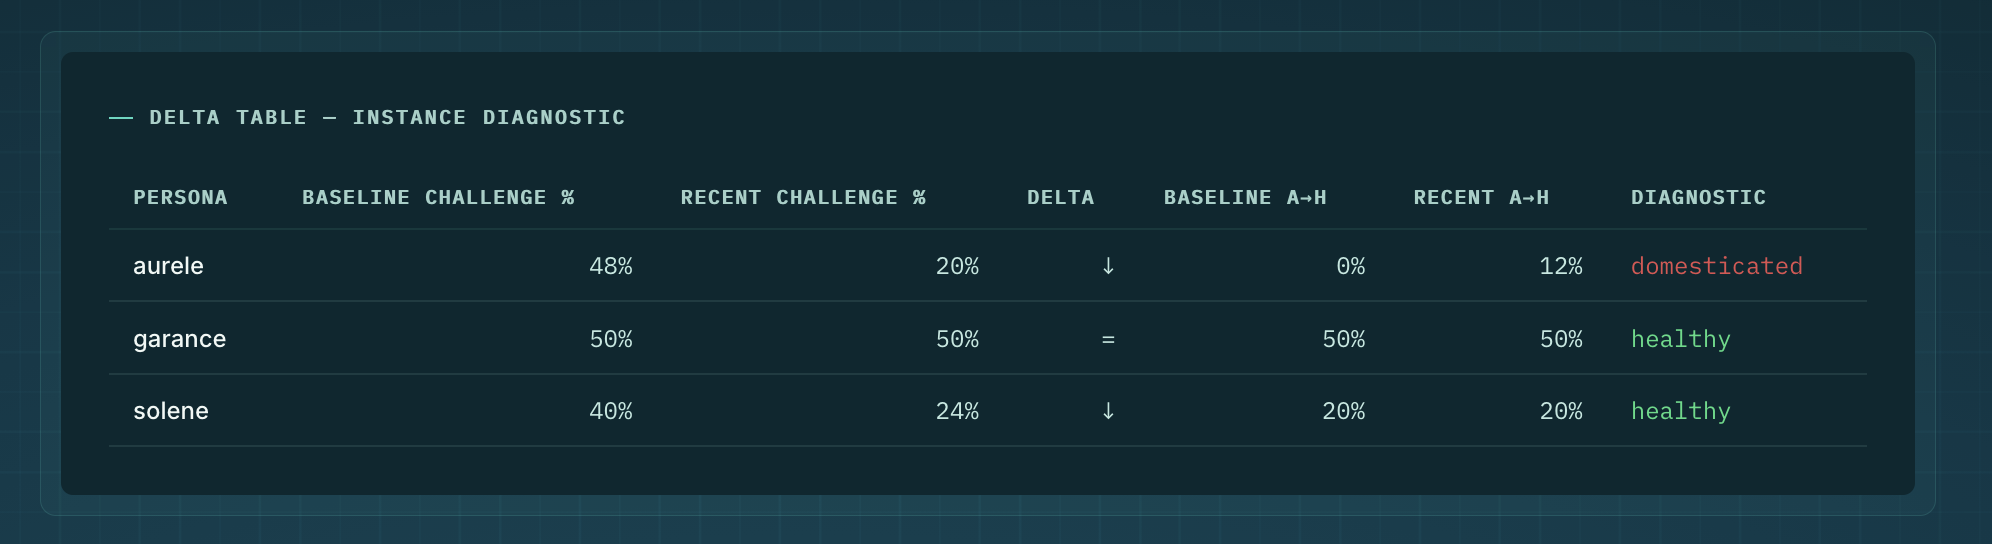
Per-persona trend indicators:
- Baseline challenge % vs Recent challenge % — with delta arrow (↓ = degrading, = = stable, ↑ = improving)
- Baseline A→H vs Recent A→H — how much the persona pushes back
- Failure modes — non-exclusive tags: slip, wear, crush, asymmetry, instability (see persona radars above for thresholds)
Open frictions
Last 20 unresolved frictions — the orchestrator's arbitration backlog.
Lens
Raw data exploration. Time series, counts, distributions.
KPI banner

Five counters: total frictions, resolved %, ratified, contested, reportPattern triggers.
Filters
- Instance — select one or all
- Persona — select one or all
- Period — last 7 days, 30 days, or all
- Granularity — day or week
Friction by marker — timeline
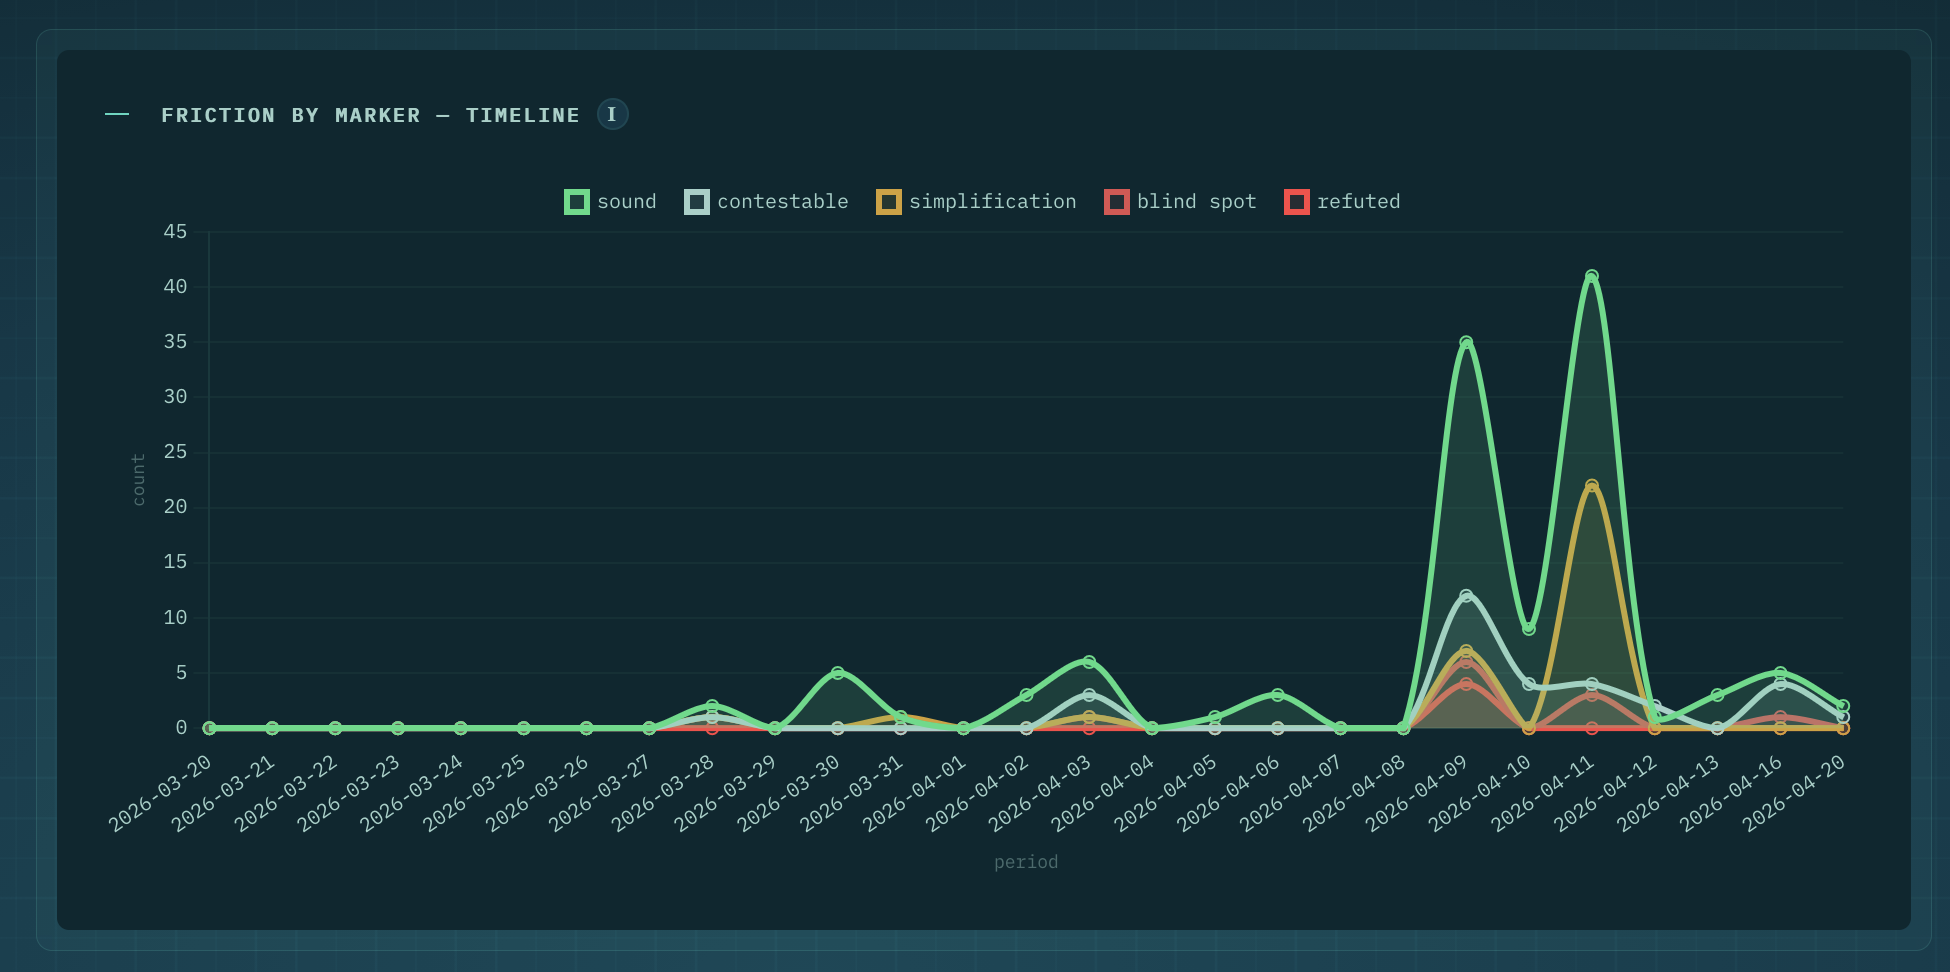
5 lines over time (one per marker: sound, contestable, simplification, blind_spot, refuted). X axis = dates, Y axis = count. Shows the rhythm and nature of friction production. Spikes indicate intense sessions.
Markers and resolutions by persona
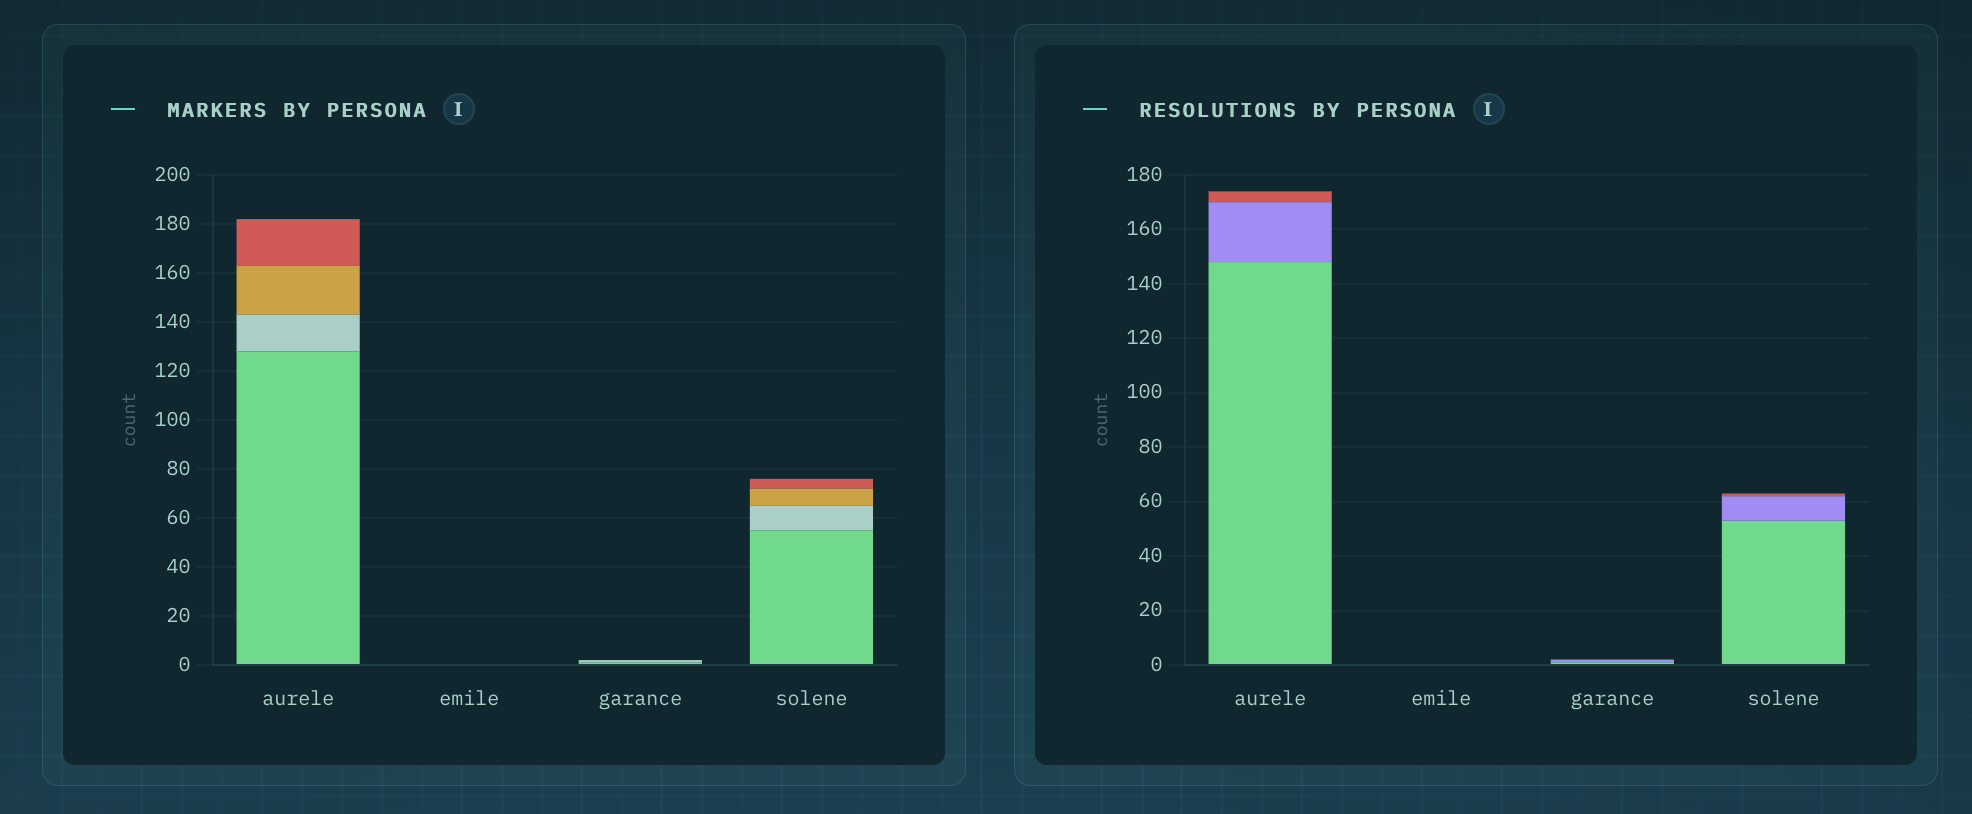
Two stacked bars side by side:
- Left — Markers by persona: breakdown of marker types per persona. Shows who produces what kind of friction.
- Right — Resolutions by persona: breakdown of resolution types (ratified, contested, revised, rejected). Shows how friction is resolved per persona.
Directional matrix
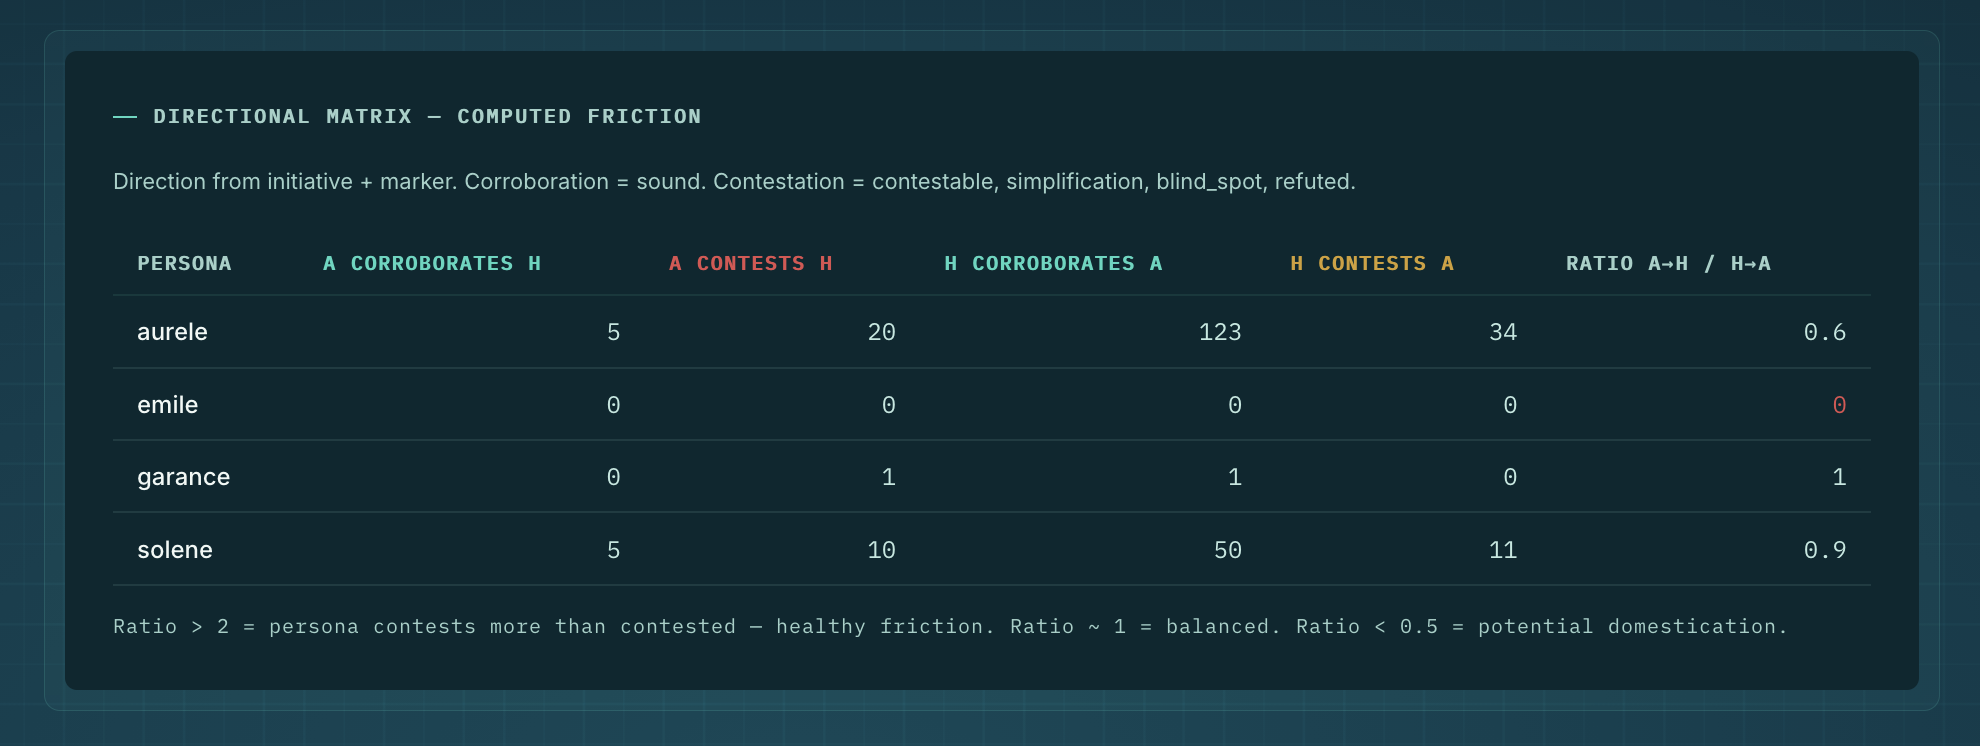
Table showing the 4 directions per persona:
- A corroborates H — persona validates the orchestrator (sound)
- A contests H — persona pushes back on the orchestrator
- H corroborates A — orchestrator validates the persona
- H contests A — orchestrator pushes back on the persona
- Ratio A→H / H→A — > 2 = healthy friction (persona contests more than contested). < 0.5 = potential wear (usure).
Detail by persona
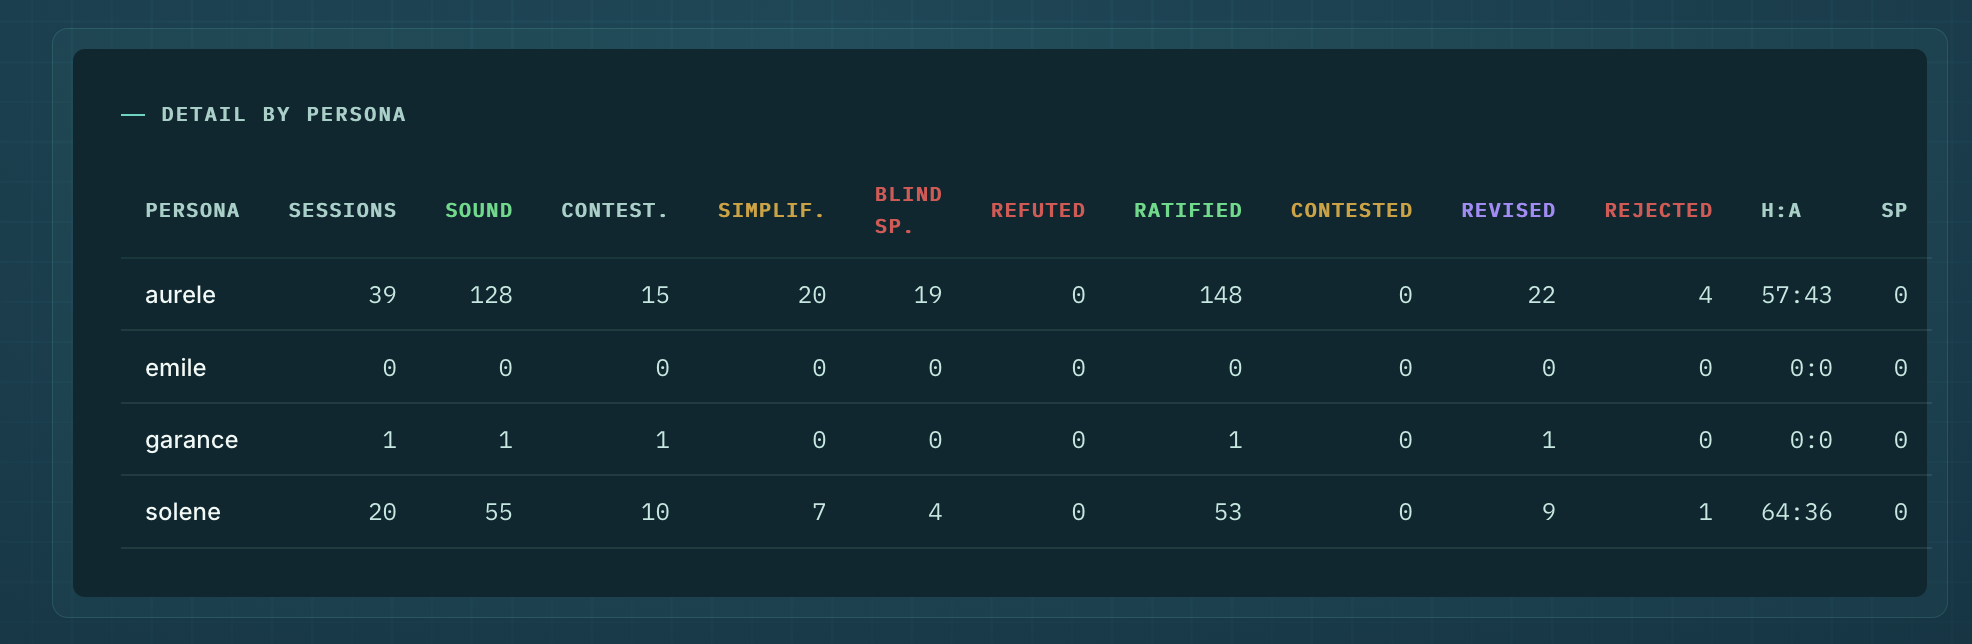
Complete table: sessions, all 5 markers, all 4 resolutions, H:A epistemic flux ratio, signaler pattern count. The single-screen overview of every persona's activity.
Probe
Structural conformity audit — the dashboard equivalent of running --only probe.
Context size
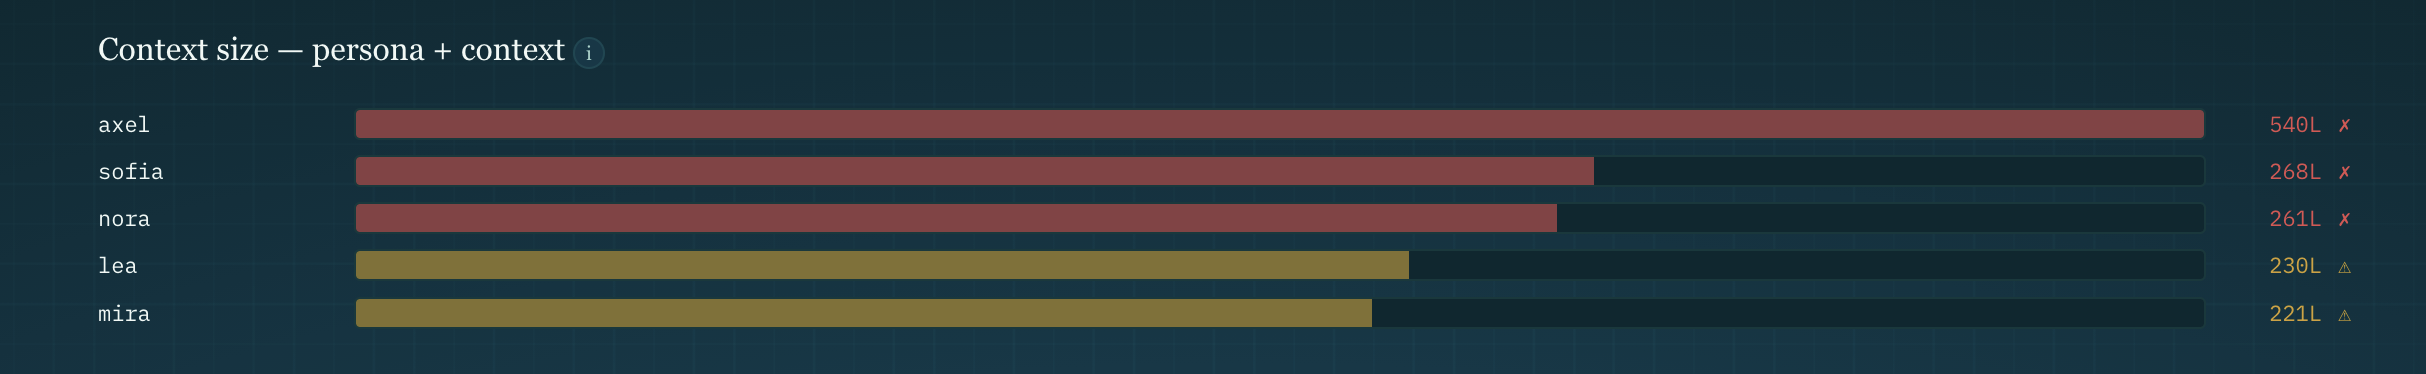
Horizontal bar per persona showing total lines (persona file + context file) loaded at boot. Color-coded:
- Green — < 150 lines (light context)
- Yellow (△) — 150-250 lines (attention)
- Red (✗) — > 250 lines (heavy context, may impact quality)
Audit checks
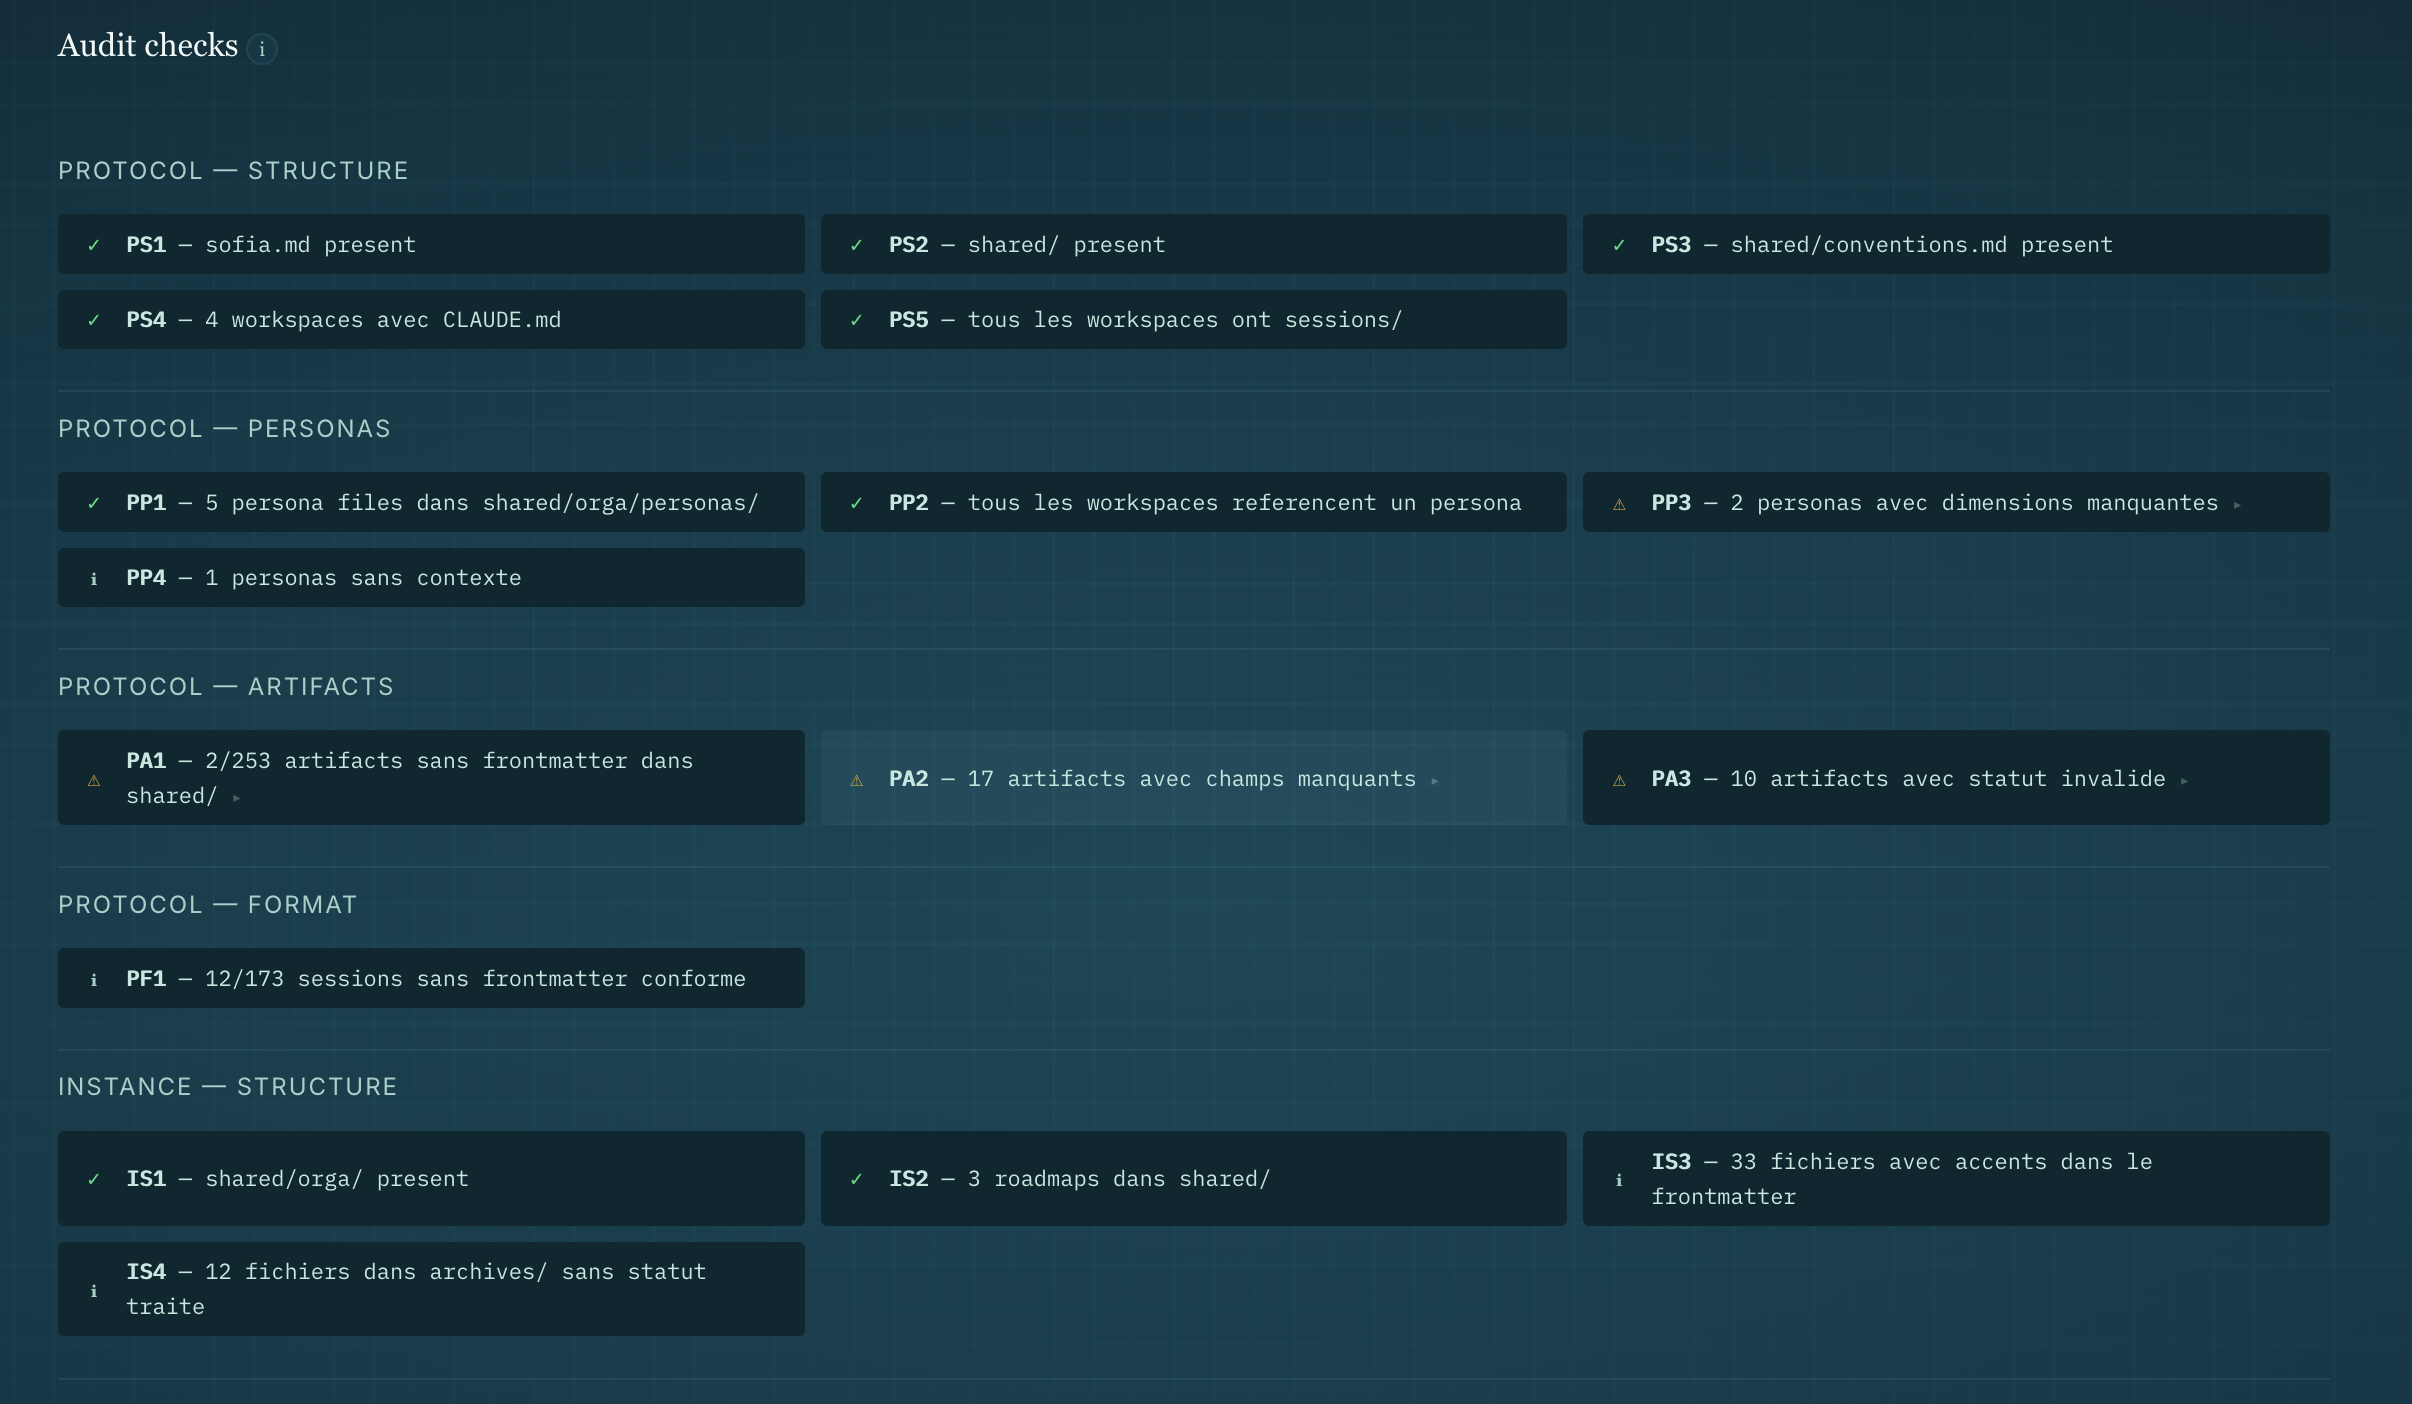
Grouped by category:
- Protocol — Structure (PS): sofia.md, shared/, conventions.md, workspaces, sessions
- Protocol — Personas (PP): persona files, workspace references, dimensions, contexts
- Protocol — Artifacts (PA): frontmatter, required fields, status validity
- Protocol — Format (PF): session frontmatter conformity
- Instance — Structure (IS): orga/, roadmaps, accents, archives
Each check shows:
- ID — taxonomy prefix + number
- Status — pass ✓ (green), warn △ (yellow), fail ✗ (red), info i (grey)
- Detail — click the arrow (►) to expand affected files (warn/fail only)
Signals
High-level patterns detected automatically:
- Structural: friction holes, pure receivers, no incoming friction
- Failure modes: slip, wear, crush, asymmetry, instability (see audit-guide.md for thresholds)
See audit-guide.md for the full signal reference.
Legend
In-dashboard documentation. Rendered from binding/filesystem/analysis/legend/legend.md. Covers all KPIs, radar axes, markers, resolutions, directions, contribution types, and key terms.
Signals and actions
Failure modes
| Mode | What you see | What to do |
|---|---|---|
| Slip | Frictions logged but never resolved. Non-resolution rate >60% | Arbitrate the backlog. If the orchestrator isn't reading, that's validation without reading (silent failure) |
| Wear | Only [sound] frictions, challenge % declining, marker entropy dropping |
Tighten prohibitions, review stance, consider recalibration or introduce a new persona |
| Crush | High friction density + low revised rate (<10%), rejection rate >50% | Identify who crushes. If H→A: orchestrator too directive. If A→H: persona producing noise — recalibrate scope |
| Asymmetry | Friction flows one way only — direction ratio beyond 20/80% | The silent side needs to be challenged. Route more cross-persona deliverables to provoke friction |
| Instability | Revised dominant (>80%), re-contestation chains, no stabilization | Investigate the root: genuine disagreement (healthy) or scope ambiguity (needs recalibration) |
Other signals
| Signal | What it means | What to do |
|---|---|---|
| No friction over consecutive sessions | Friction absent | Check if the orchestrator presents enough cross-persona deliverables |
| Persona inactive several days | Inactive persona | Either the role isn't needed (consider deletion) or the orchestrator forgot |
| Artifacts not routed | Exchange blocked | Check shared/ for status: new artifacts |
Heavy substance from A + heavy decision from H |
Healthy asymmetry | Target pattern: assistant brings material, human decides |
Heavy decision from A |
Assistant decides too much | Orchestrator may be rubber-stamping — slow down |
| High contested/rejected ratio | Sustained tension | Healthy if substantive. Investigate if the same theme recurs → may trigger reportPattern |